
Stuffed runs: running backs ranked
The share of his carries that gain nothing or lose yards. Fewer is better, and the line shares the blame.
Why the box score misses it: Hidden inside the yards per carry.
Best so far: James Cook (BUF), 6%. A typical running back is 18%. Players need at least 20 carries to qualify, so nobody is ranked on a handful of plays. Lower is better.
Grades updated Rechecked every few hours on game days
- EPA per carry
- Success rate
- Explosive runs
- Yards after contact
- Broken tackles
- Stuffed runs
- Yards before contact
- Runs to the edge
- Carries from shotgun
- Carries
- Rushing yards
- Rushing touchdowns
54 of 54 running backs
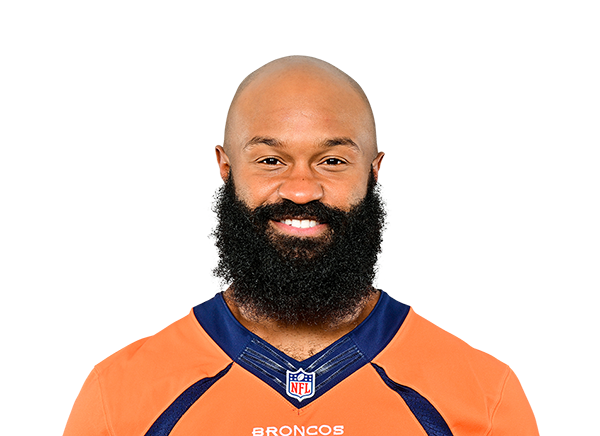
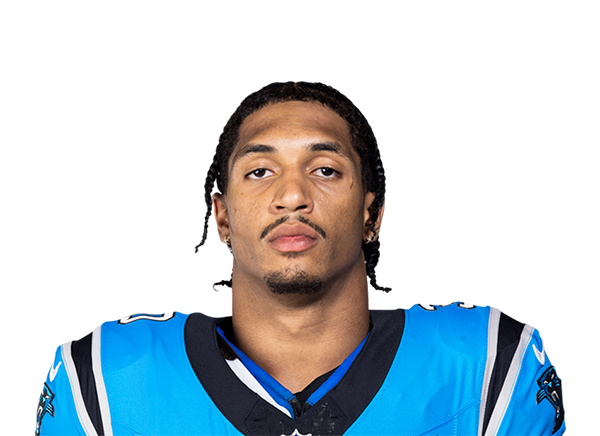
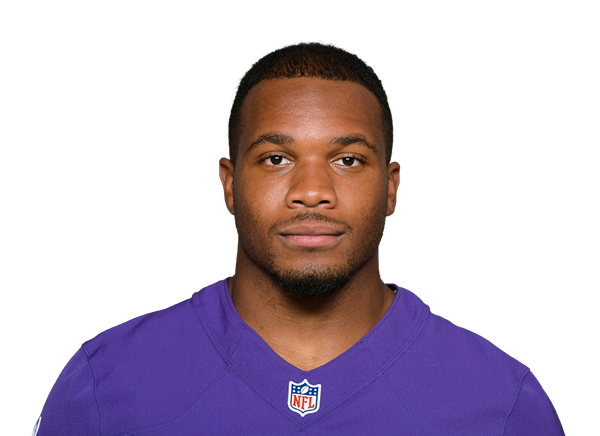
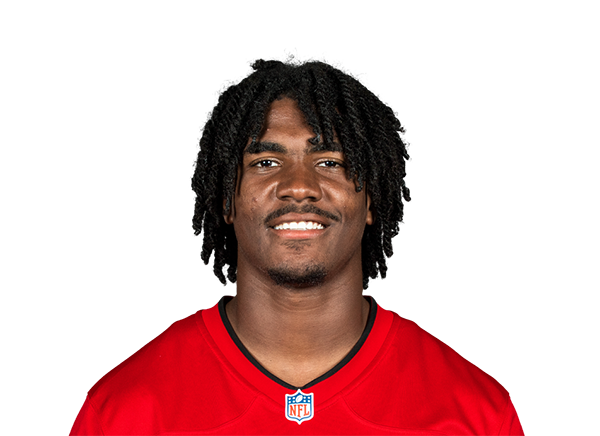
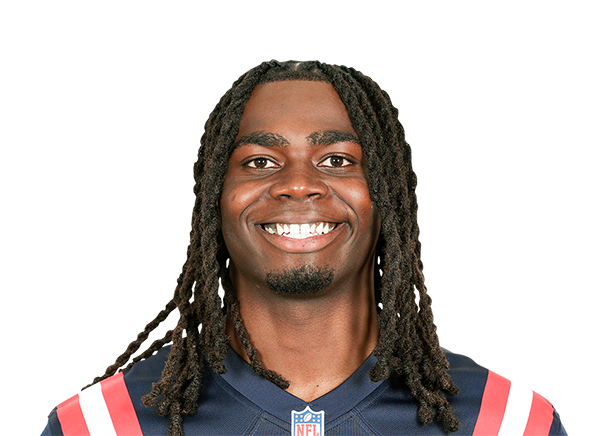
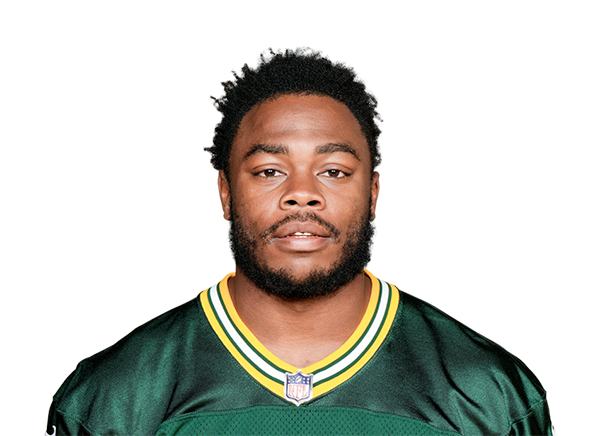
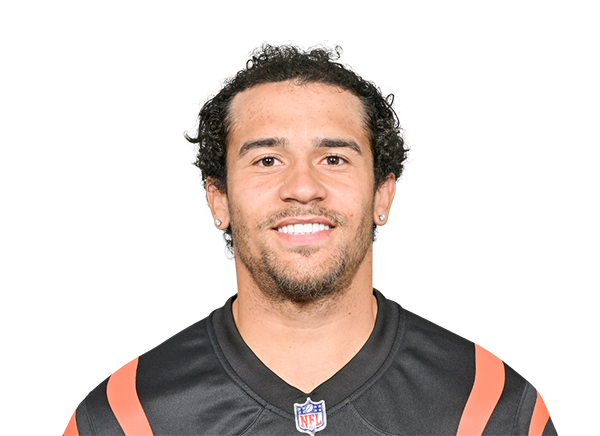
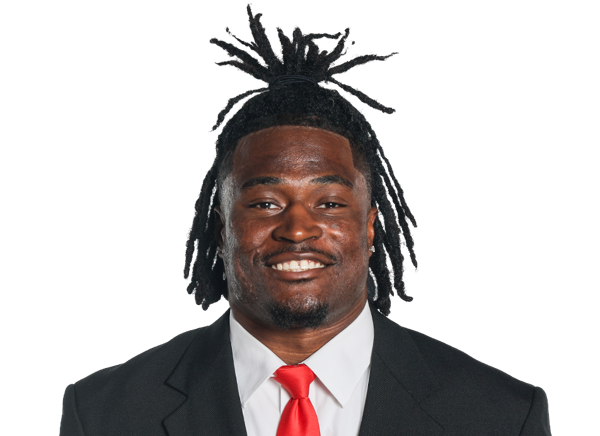
| Player | Against the league | ||||
|---|---|---|---|---|---|
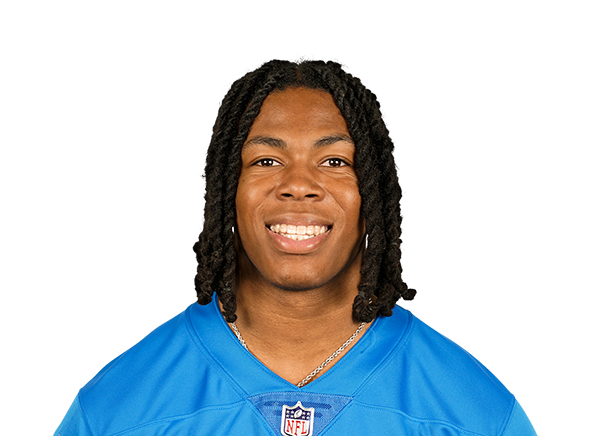
| 1 | 6% | 68 | −2.1grade points down | ||
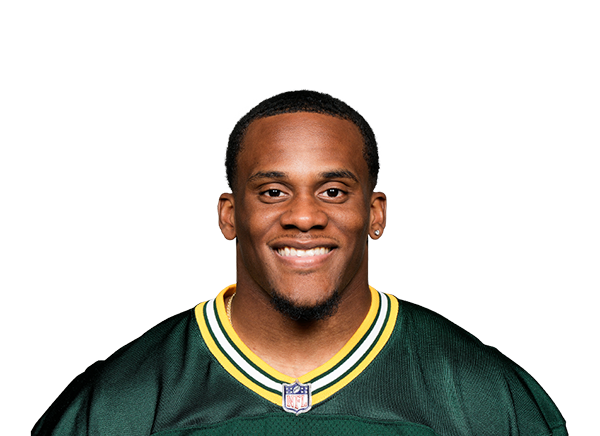
| 2 | 8% | 53 | −8.4grade points downWithin the noise | ||
| 3 | 8% | 26 | +2.9grade points up | ||
| 4 | 9% | 66 | +9.8grade points upLeaning that way | ||
| 5 | 11% | 75 | +5.0grade points upWithin the noise | ||
| 6 | 11% | 27 | – | ||
| 7 | 11% | 62 | −12.7grade points downLeaning that way | ||
| 8 | 11% | 61 | −7.5grade points downWithin the noise | ||
| 9 | 12% | 33 | −9.2grade points downWithin the noise | ||
| 10 | 14% | 81 | +2.4grade points up | ||
| 11 | 14% | 57 | +15.9grade points upLeaning that way | ||
| 12 | 14% | 99 | −3.6grade points downWithin the noise | ||
| 13 | 14% | 28 | +25.8grade points upA clear change | ||
| 13 | 14% | 28 | −12.9grade points downLeaning that way | ||
| 15 | 14% | 76 | −8.3grade points downLeaning that way | ||
| 16 | 15% | 96 | +3.8grade points upWithin the noise | ||
| 17 | 15% | 68 | even | ||
| 18 | 15% | 47 | +2.1grade points up | ||
| 19 | 16% | 32 | −7.2grade points downWithin the noise | ||
| 20 | 16% | 51 | +13.9grade points upLeaning that way | ||
| 21 | 16% | 63 | +5.6grade points upWithin the noise | ||
| 22 | 16% | 25 | −23.5grade points downLeaning that way | ||
| 23 | 16% | 31 | – | ||
| 24 | 16% | 67 | +12.3grade points upLeaning that way | ||
| 25 | 17% | 35 | +1.3grade points up | ||
| 26 | 18% | 56 | +9.3grade points upWithin the noise | ||
| 26 | 18% | 28 | – | ||
| 26 | 18% | 56 | even | ||
| 26 | 18% | 28 | +11.6grade points upWithin the noise | ||
| 30 | 18% | 100 | +19.1grade points upA clear change | ||
| 31 | 18% | 72 | +11.5grade points upWithin the noise | ||
| 32 | 19% | 70 | +10.2grade points upWithin the noise | ||
| 33 | 19% | 113 | −4.8grade points downLeaning that way | ||
| 34 | 19% | 86 | −11.0grade points downA clear change | ||
| 35 | 19% | 37 | −19.1grade points downLeaning that way | ||
| 36 | 19% | 72 | +4.2grade points upWithin the noise | ||
| 37 | 20% | 102 | +11.6grade points upLeaning that way | ||
| 38 | 20% | 40 | −14.0grade points downLeaning that way | ||
| 38 | 20% | 20 | – | ||
| 40 | 21% | 73 | −17.7grade points downA clear change |






























How to read this table
- The number on the left is the league rank among running backs, even when the list is filtered to one team.
- “Against the league” draws each player on the same strip: the ends are the 10th-best and 90th-best player, the shaded stretch is the middle half, and the tick is the median. Right is always better.
- “Lately” is the change in grade between a player's last 2 games and the games before them. The tag says whether the change is bigger than what a few plays could cause.
- Tick “Show the box score” to put the traditional totals next to the advanced number and sort by either.
Other leaderboards
Quarterbacks
Running backs
Wide receivers
Tight ends
Edge rushers
Interior linemen
Linebackers
Cornerbacks
Safeties
Kickers
Punters
Kick returners
13 positions · 9 advanced stats here · Compare two players
← All players
Data: nflverse play-by-play, CC BY 4.0. Also FTN charting, Pro Football Reference advanced stats, snap counts and injury reports, all through nflverse. Calculations and charts by Raiders Rundown.
More from the Lab
All 9 tools →- NFL Playoff MachineNewThrough week 5Pick every game left and watch the seeds, bracket and playoff odds move.
- Sunday Rooting GuideNewThrough week 5Which games to root for, ranked by how much each moves your team's playoff odds.
- This week's matchupsWeek 5Every game on the slate, position group by position group.
- Top playsThe snaps that moved the Raiders' chance to win the most.
- Scouting reportsWeek 5Where the Raiders have the edge on every opponent.
- How all 32 teams stack upQuarterback, line, receivers and coverage, ranked across the league.
- Will it last?The Raiders' hottest and coldest stats, against teams since 1999.
- Season twinsThe past teams that looked the most like these Raiders.