
Tight ends receiving: down, distance and the red zone
Who actually delivers on 3rd down, on 3rd and short, or inside the 20? Every tight end in the league, ranked in the spot you pick. Every pass thrown to him, caught or not. A box score cannot say whether a player's yards came when the offense needed them, and this can.
Success rate: How often a play leaves the offense better off than before it: it added expected points (EPA above zero). Roughly, that is gaining about 40% of the yards to go on 1st down, 60% on 2nd, and all of them on 3rd and 4th.
Grades updated Rechecked every few hours on game days
- Quarterbacks passing
- Running backs rushing
- Wide receivers receiving
- Tight ends receiving
- Running backs receiving
- Quarterbacks running
21 of 21 tight ends with at least 5 targets on 3rd down. The average tight end there: 46% success rate on 219 targets in all.
| # | Player | Targets | Success | Yds/tgt | EPA/tgt | 1st down | Catch % | vs. league |
|---|---|---|---|---|---|---|---|---|
| League average | 219 | 46% | 6.9 | +0.24 | 43% | 65% | ||
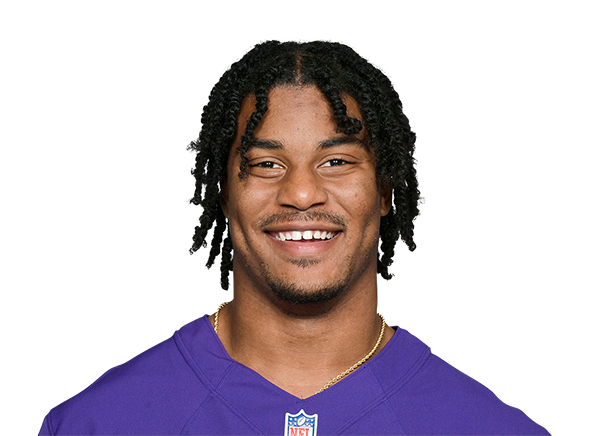
| 1 | T.J. HockensonTE · MIN | 10 | 80% | 7.7 | +1.26 | 80% | 100% | +34 ptsbetter than the league |
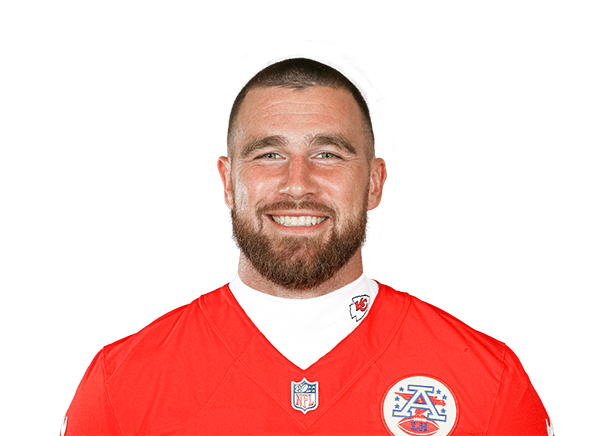
| 2 | Travis KelceTE · KC | 5 | 80% | 18.4 | +1.82 | 80% | 80% | +34 ptsbetter than the league |
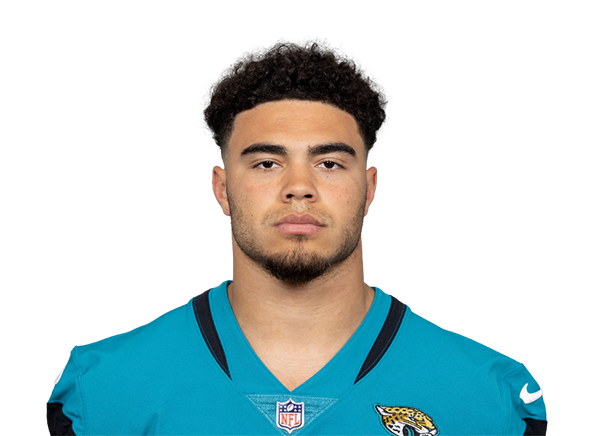
| 3 | Brenton StrangeTE · JAX | 6 | 67% | 13.5 | +1.24 | 67% | 100% | +21 ptsbetter than the league |
| 4 | Dallas GoedertTE · PHI | 6 | 67% | 13.5 | +1.41 | 50% | 83% | +21 ptsbetter than the league |
| 5 | Isaiah LikelyTE · NYG | 13 | 62% | 8.6 | +0.79 | 62% | 85% | +15 ptsbetter than the league |
| 6 | Brock BowersTE · LV | 18 | 61% | 8.8 | +0.58 | 61% | 61% | +15 ptsbetter than the league |
| 7 | Cade OttonTE · TB | 5 | 60% | 11.0 | +0.44 | 60% | 80% | +14 ptsbetter than the league |
| 8 | Dalton SchultzTE · HOU | 10 | 50% | 11.9 | +0.59 | 50% | 80% | +4 ptsbetter than the league |
| 9 | Tyler WarrenTE · IND | 6 | 50% | 4.7 | +0.21 | 50% | 67% | +4 ptsbetter than the league |
| 10 | Trey McBrideTE · ARI | 15 | 47% | 3.5 | −0.06 | 40% | 60% | +1 ptsbetter than the league |
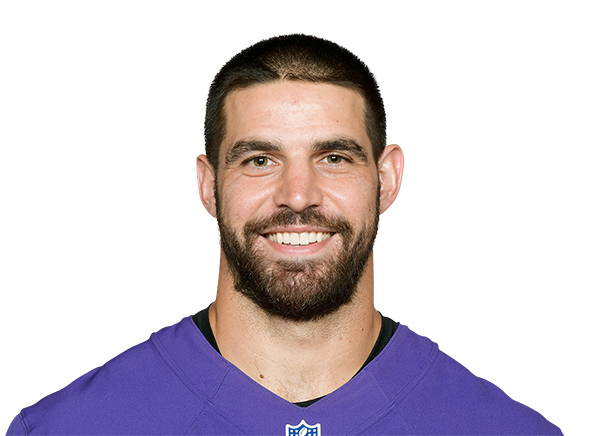
| 11 | Mark AndrewsTE · BAL | 13 | 46% | 5.8 | +0.05 | 46% | 69% | +0 ptsbetter than the league |
| 12 | Pat FreiermuthTE · PIT | 7 | 43% | 4.6 | +0.13 | 43% | 43% | −3 ptsworse than the league |
| 13 | Juwan JohnsonTE · NO | 10 | 40% | 6.1 | +0.22 | 40% | 80% | −6 ptsworse than the league |
| 14 | Gunnar HelmTE · TEN | 5 | 40% | 4.6 | −0.29 | 20% | 80% | −6 ptsworse than the league |
| 15 | Harold Fannin Jr.TE · CLE | 9 | 33% | 3.1 | +0.10 | 33% | 44% | −13 ptsworse than the league |
| 16 | Colston LovelandTE · CHI | 7 | 29% | 6.3 | −0.16 | 29% | 57% | −18 ptsworse than the league |
| 17 | Sam LaPortaTE · DET | 7 | 29% | 2.7 | −0.41 | 14% | 29% | −18 ptsworse than the league |
| 18 | Darren WallerTE · CAR | 5 | 20% | 2.6 | +0.02 | 20% | 40% | −26 ptsworse than the league |
| 19 | Kenyon SadiqTE · NYJ | 5 | 20% | 4.4 | −1.34 | 0% | 60% | −26 ptsworse than the league |
| 20 | Oronde Gadsden IITE · LAC | 8 | 0% | 2.1 | −1.01 | 0% | 25% | −46 ptsworse than the league |
| 21 | Evan EngramTE · DEN | 6 | 0% | 2.8 | −1.27 | 0% | 33% | −46 ptsworse than the league |










How to read this table
- The number on the left is the rank among every tight end with enough targets in the spot you picked, even when the list is filtered to one team.
- The first row is the league average in that spot. A green arrow means a player is better than it, a red arrow worse, and a dot means about the same. Every arrow has a word beside it for screen readers.
- Success rate. How often a play leaves the offense better off than before it: it added expected points (EPA above zero). Roughly, that is gaining about 40% of the yards to go on 1st down, 60% on 2nd, and all of them on 3rd and 4th.
- Yards per target. Total yards over the number of plays. It rewards the long gain but does not know what down it came on.
- EPA per target. Expected points added: how many points the play added to (or took from) the offense's scoring chances, given the down, the distance and the field position.
- First-down rate. The share of plays that ended in a first down or a touchdown: the offense moved the chains or scored.
- Catch rate. The extra number that belongs to the job: runs of 10+ yards for a ball carrier, the catch rate for a receiver, and for a passer how often a dropback ends in a sack.
- Small spots mean small samples. The minimum starts where the season's ranking does, and you can lower it to see everyone, at your own risk.
Data: nflverse play-by-play, CC BY 4.0. Also FTN charting, Pro Football Reference advanced stats, snap counts and injury reports, all through nflverse. Calculations and charts by Raiders Rundown.
More from the Lab
All 9 tools →- NFL Playoff MachineNewThrough week 5Pick every game left and watch the seeds, bracket and playoff odds move.
- Sunday Rooting GuideNewThrough week 5Which games to root for, ranked by how much each moves your team's playoff odds.
- This week's matchupsWeek 5Every game on the slate, position group by position group.
- Top playsThe snaps that moved the Raiders' chance to win the most.
- Scouting reportsWeek 5Where the Raiders have the edge on every opponent.
- How all 32 teams stack upQuarterback, line, receivers and coverage, ranked across the league.
- Will it last?The Raiders' hottest and coldest stats, against teams since 1999.
- Season twinsThe past teams that looked the most like these Raiders.