Most of his numbers are still mostly luck; 50 is average
Grades updated Rechecked every few hours on game days
What we can and cannot say about a lineman. No public data credits one lineman with a block won or lost. This page shows what does exist: how often he is flagged compared with the other linemen, how much he plays, and how his whole line does in the games he starts. The line's numbers are shared by the five who start together, so they describe the unit more than the man.
01
01 / 12
The read
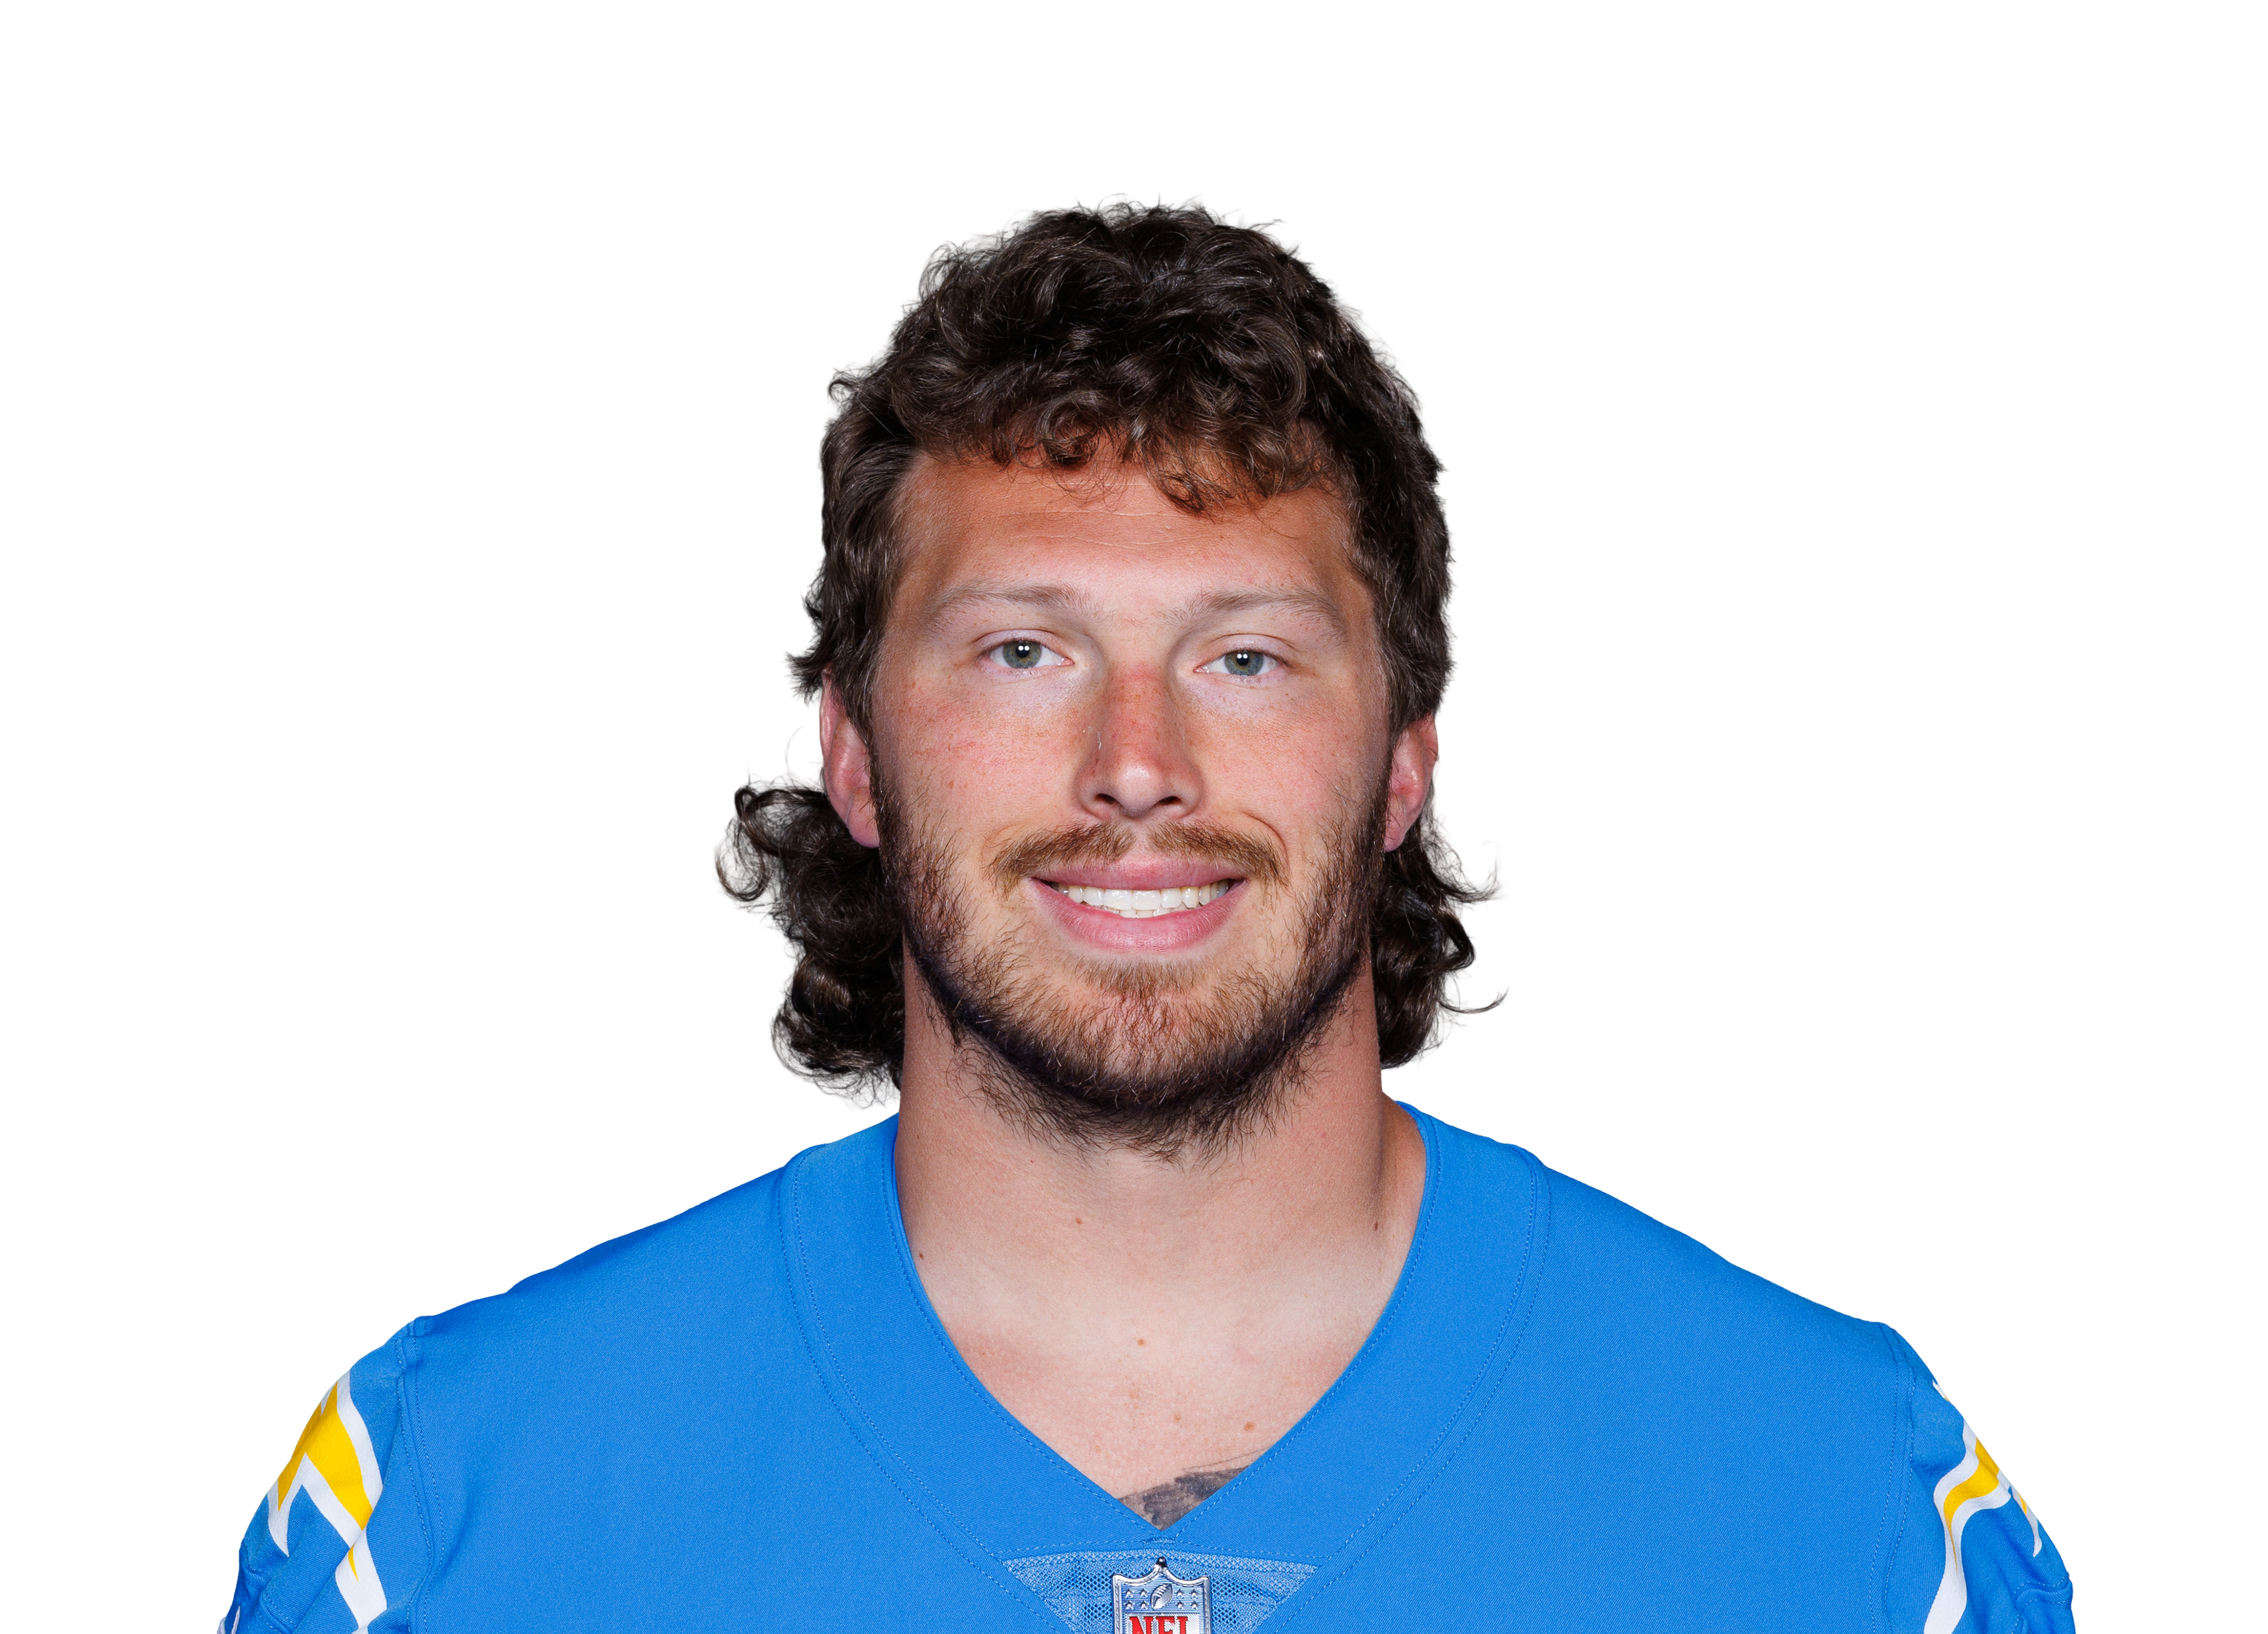
Cole has played 5 games for 319 offensive snaps, 5 games started and 4 penalties, but every advanced number is still mostly luck at this point, so his grade of 47 is a placeholder rather than a verdict.
Game to game on line run success: best 62% in Week 3 against BUF, worst 19% in Week 5. He beat the typical offensive lineman's line run success in 1 of 5 games.
Season rank slipped: 33rd to 16th percentile since Wk 2.
Lately he is playing worse. Line run success is 29% over the last 2 games (56 runs), against 44% before that. The change points one way, but a few plays could still explain it.
When he plays he is on the field for nearly every play.
Too early to call: sacks allowed by his line and penalties per 1,000 snaps. After 5 games the gaps between offensive linemen on those stats are still mostly chance, so we show them without ranking.
Written from his numbers, not from film. 5 games are behind the season figures.
02
02 / 12
His team
A player is part of a unit. Here is how the Los Angeles Chargers do at his job, and who he shares the room with.
Cole is the Chargers' 6th-best offensive lineman by grade (of 7), and the Chargers' offensive line ranks 32nd of 32.
Overall grade, 20 to 80, against all offensive linemen in the league. A teammate with too few plays to grade is listed without one.
03
03 / 12
How he stacks up
Every graded stat at a glance, against all the offensive linemen in the league.
WorstAverageBest
Line run successwhole line's number3037%114th of 162small sample
Holding per 1,000 snapsToo early to rank3.1mostly luck so far
Penalties per 1,000 snapsToo early to rank12.5mostly luck so far
Sacks allowed by his linewhole line's numberToo early to rank9.3%mostly luck so far
False starts per 1,000 snapsToo early to rank6.3mostly luck so far
Left is the worst at his job, right is the best, and the line down the middle is average. The bubble is his percentile: 90 means better than nine in ten qualifying offensive linemen. Faded bars are still small samples. Outlined bars are stats where, this early, the gaps between players are mostly luck, so they are not ranked yet.
04
04 / 12
In the league
Every offensive lineman in the league as a dot: pick any two stats and see where he sits, who is around him, and who is ahead.
Who is around him on the leaderboards
His best numbers, with the offensive linemen just ahead of and behind him. A number is easier to judge beside the names.
Size and age are not good or bad. They show what kind of offensive lineman he is and how he compares physically with the offensive linemen in the league.
Height
6'5"
Cole Strange is taller than 50% of offensive linemen.
6'3"low to high · typical 6'5"6'7"
Weight
301 lbs
Cole Strange is lighter than 94% of offensive linemen.
305low to high · typical 315330
Age
28
Cole Strange is older than 67% of offensive linemen.
23low to high · typical 2731
05
05 / 12
How he has progressed
Where he has ranked among offensive linemen after each week, and every game behind it.
Season rank climbed: 20th to 30th percentile since Wk 2.
The line is his season-to-date rank among players at his position after each week, from 99 (the best in the league) down to 1 (the worst). It rises when he passes other players, not when he has one big game. Early weeks are noisier because fewer plays are behind them. The shaded weeks are the recent stretch.
Line run success game by game
Week
Opponent
That game
runs
Season rank after
1
vs ARI
38%
16
Not yet
2
vs LV
32%
31
20th pct
3
vs BUF
62%
26
69th pct
4
vs SEA
40%
25
59th pct
5
vs DEN
19%
31
30th pct
“Not yet” means too little of the season was behind him to rank him fairly against offensive linemen. A week-by-week rank needs most of the 150 snaps that grade a full season, so early weeks stay blank for players who see few plays, like kickers. It says nothing about how he played.
One game is a small sample: a single stat over 26 runs can swing on a handful of plays. Shaded rows are the recent stretch.
06
06 / 12
The numbers, in context
Each one against every offensive lineman with at least 150 snaps. Right on the strip is better.
Line run success
▼Below typical
37%
114th of 162 offensive linemen · bottom 31%
33%worse to better48%
This is his whole line's number: every lineman who starts beside him shares it, so it says how the unit is doing more than how he is.
How often the team's designed runs gain enough to keep the offense on schedule, in the games he started. It is the line, the backs and the scheme together, and the five linemen who start together share it.
The box score: Team rushing yards ignore the down and the distance.
Does it show up in winning? Across 524 games league-wide, teams won 68% of the time when their offensive lineman was in the best third on line run success, and 49% when he was in the worst third.
Sacks allowed by his line
Mostly luck so far
9.3%lower is better
Too early to rank. On 172 dropbacks, luck still decides who is on top of offensive linemen.
9.1%worse to better3.5%
This is his whole line's number: every lineman who starts beside him shares it, so it says how the unit is doing more than how he is.
Sacks as a share of the team's dropbacks in the games he started. It is the line and the quarterback together, and every lineman who starts beside him shares it. Fewer is better.
The box score: No sack is charged to a single lineman in the box score.
Does it show up in winning? Across 576 games league-wide, teams won 49% of the time when their offensive lineman was in the best third on sacks allowed by his line, and 30% when he was in the worst third.
Penalties per 1,000 snaps
Mostly luck so far
12.5lower is better
Too early to rank. On 319 snaps, luck still decides who is on top of offensive linemen.
13.0worse to better0.0
Accepted penalties called on him (holding, false starts and the rest) for every 1,000 snaps he plays. Fewer is better.
The box score: A season total is bigger for the lineman who simply played more snaps.
Does it show up in winning? Across 505 games league-wide, a good or bad game on penalties per 1,000 snaps from a offensive lineman has not lined up much with his team winning (54% wins in the best third, 57% in the worst).
Holding per 1,000 snaps
Mostly luck so far
3.1lower is better
Too early to rank. On 319 snaps, luck still decides who is on top of offensive linemen.
6.4worse to better0.0
Offensive holding penalties for every 1,000 snaps. It is part of the penalty rate, shown on its own because holding is the penalty that blocking causes. Fewer is better.
The box score: A season total is bigger for the lineman who simply played more snaps.
Does it show up in winning? Across 505 games league-wide, a good or bad game on holding per 1,000 snaps from a offensive lineman has not lined up much with his team winning (53% wins in the best third, 58% in the worst).
False starts per 1,000 snaps
Mostly luck so far
6.3lower is better
Too early to rank. On 319 snaps, luck still decides who is on top of offensive linemen.
6.6worse to better0.0
False starts for every 1,000 snaps: a lapse in focus rather than in blocking. Fewer is better.
The box score: A season total is bigger for the lineman who simply played more snaps.
Does it show up in winning? Across 505 games league-wide, a good or bad game on false starts per 1,000 snaps from a offensive lineman has not lined up much with his team winning (54% wins in the best third, 58% in the worst).
07
07 / 12
How he plays
Tendencies: how his game differs from the offensive linemen around him. These are not better or worse, only different, and often say as much about the offense or defense he plays in as about him.
Share of snaps when he plays
Style
97%
Right in line with the typical offensive lineman. The typical offensive lineman is at 99% (nearly all).
28%low to high · typical 99%100%
The share of the offense's snaps he is on the field for in the games he plays. It says whether he is a full-time starter or a part of a rotation.
08
08 / 12
Contract & cap
Cole Strange's deal is 2 years and $13.0M, $6.5M a year. $7.0M of it is guaranteed, 54% of the total.
Per year
$6.5M
average over the deal
Cap hit, 2026
$5.2M
1.7% of the $301.2M cap
Guaranteed
$7.0M
54% of the total, at signing
Runs through
–
2-year deal, final year not tracked
71st-highest paid of the 161 offensive linemen we track
Each dot is one of the offensive linemen on the teams we track, placed by what he is paid a year.
Pay against play
Early read
Among the 161 offensive linemen we have a grade and a contract for, Cole Strange is 146th on the field and 71st in pay. His grade is still an early read, so this says nothing yet about whether his pay is fair.
On the field (overall grade)146 of 161
In pay71 of 161
Ranks are among the 161 offensive linemen on the teams we track who have both a grade and a contract. A rank near the right of a bar is better play or higher pay.
Contract figures as of 2026-10-12, read from public cap sites (StickToTheModel team cap pages and OverTheCap contracts list and player pages) into a file we keep by hand, for all 32 teams. A deal signed, cut or reworked since may differ, and cap hits are rounded to $0.1M.
09
09 / 12
Playing time
He has played in 5 of his team's 5 games with snap counts, on the field for about 97% of the team's offensive plays when he plays.
100%
ARI
84%
LV
100%
BUF
100%
SEA
100%
DEN
Each column is a game: the share of his team's offensive snaps he played. 80% means about 8 of every 10 plays. “Out” means he did not play; a question mark means snap counts are not posted yet. Shaded games are the recent stretch.
10
10 / 12
Game by game
Every game this season: how it ended for his team, how much he played, his box score, and the advanced numbers from that one game. One game is a small sample, so read the right-hand columns as a snapshot, not his level. A dash means that number is not in yet (charting posts a day or two after a game), not a zero.
Line run successHigher is better
▲ Best game
62%Week 3 BUF, L 16–24on 26 runs
▼ Worst game
19%Week 5 DEN, L 17–23on 31 runs
Penalties per 1,000 snapsLower is better
▲ Best game (lowest)
0.0Week 1 ARI, L 14–26on 55 snaps
▼ Worst game (highest)
29.0Week 3 BUF, L 16–24on 69 snaps
Cole Strange game by game
Game
Result
Snaps
Snaps
GS
Pen
Hold
FS
Line runs
Line sack rate
Penalties/1,000
Wk 1vs ARI
L 14–26
100%
55
1
0
0
0
38%
8.6%
0.0
Wk 2vs LV
L 14–26
84%
57
1
0
0
0
32%
9.7%
0.0
Wk 3vs BUF
L 16–24
100%
69
1
2
0
2
62%
5.4%
29.0
Wk 4vs SEA
L 23–30
100%
71
1
1
0
0
40%
7.9%
14.1
Wk 5vs DEN
L 17–23
100%
67
1
1
1
0
19%
16.1%
14.9
11
11 / 12
The box score
The traditional totals, with where each ranks among offensive linemen. A total rewards volume, which is why the advanced numbers above matter.
Ranks are among players at the same job who have enough plays to be graded. Grades and rankings come from play-by-play, charting and snap-count data, so they cannot see blocking, route running or assignments. See how the grades work.
Data: nflverse play-by-play, CC BY 4.0. Also FTN charting, Pro Football Reference advanced stats, snap counts and injury reports, all through nflverse. Calculations and charts by Raiders Rundown.