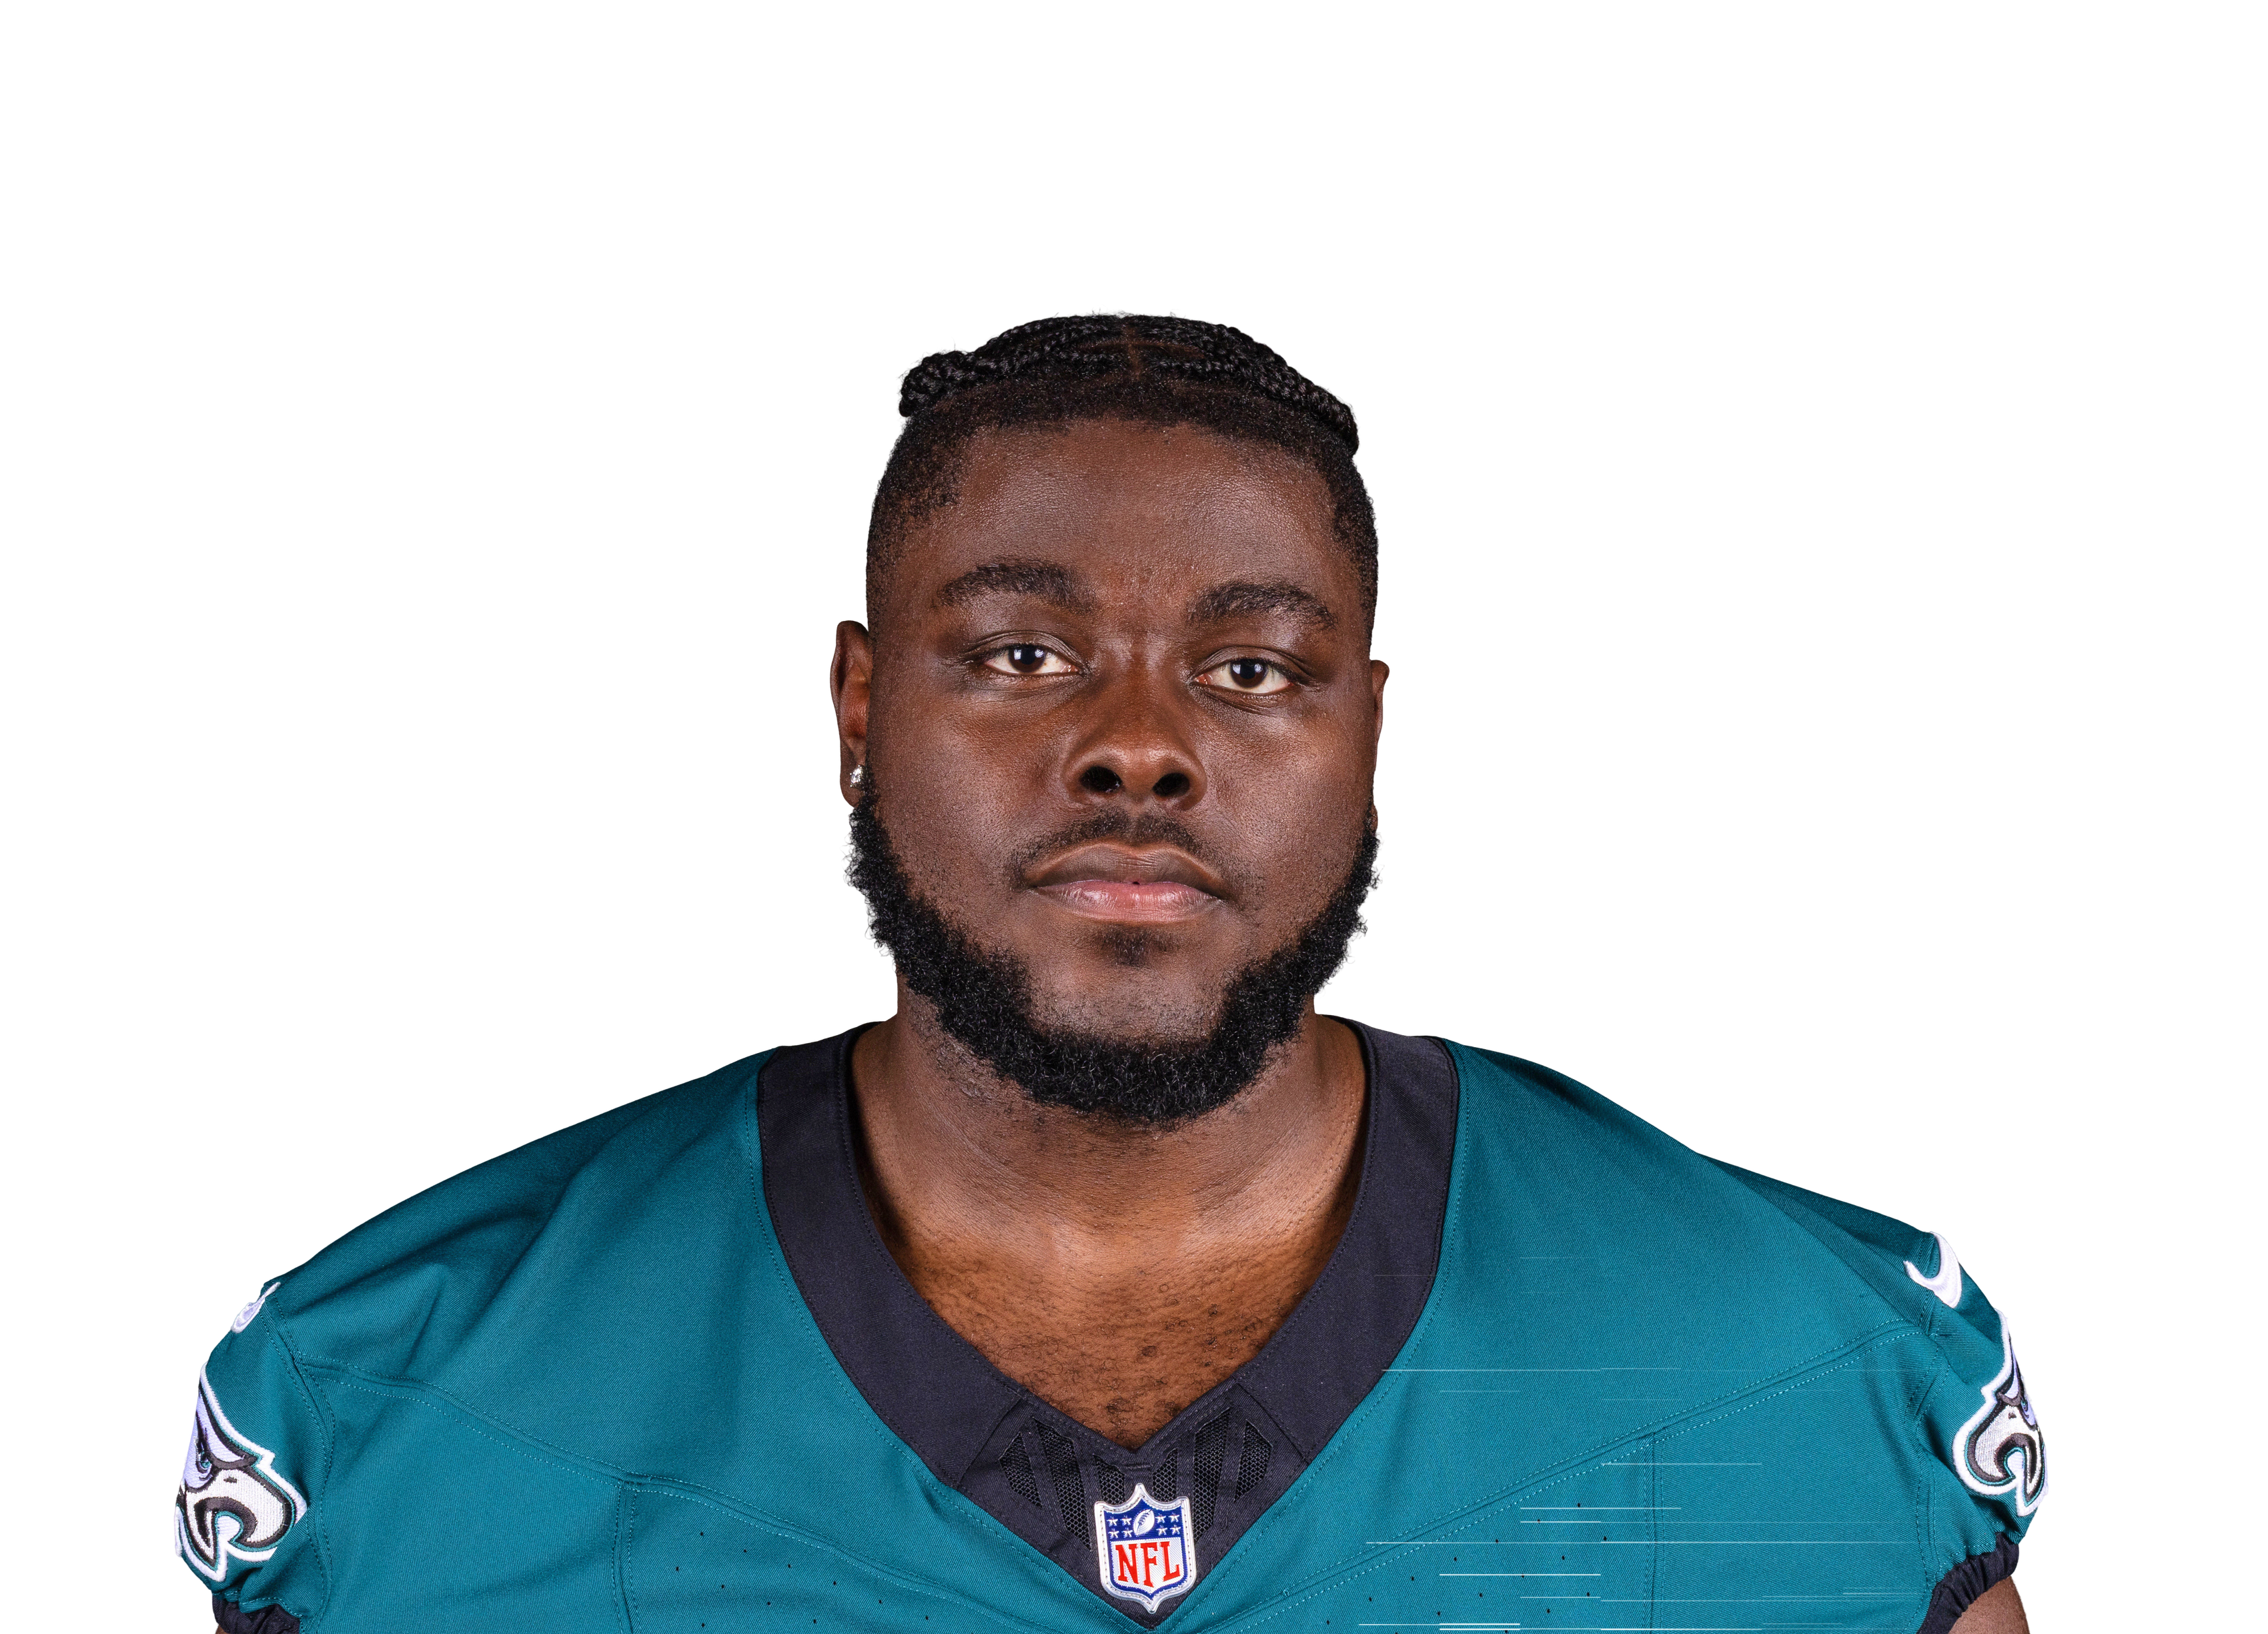

PHI Philadelphia Eagles · OL· #72

Markel Bell

Age
22
Height
6'9"
Weight
346 lbs
College
Miami; Holmes County JC
Drafted
2026, No. 68 overall (PHI)
Experience
Rookie

Eagles 2-3Offense 30thDefense 24th

48

Overall

144th of 162 offensive linemen

Early read

Most of his numbers are still mostly luck; 50 is average

Grades updated Rechecked every few hours on game days

What we can and cannot say about a lineman. No public data credits one lineman with a block won or lost. This page shows what does exist: how often he is flagged compared with the other linemen, how much he plays, and how his whole line does in the games he starts. The line's numbers are shared by the five who start together, so they describe the unit more than the man.

01 / 11

The read

Markel has played 3 games for 124 offensive snaps, 2 games started and 2 penalties, but every advanced number is still mostly luck at this point, so his grade of 48 is a placeholder rather than a verdict.

  • Back in the lineup: He missed 2 games earlier, then played all of the last 2 games, on the field for nearly every play when he plays.
  • Too early to call: sacks allowed by his line. After 5 games the gaps between offensive linemen on that stat are still mostly chance, so we show it without ranking.

Written from his numbers, not from film. 3 games are behind the season figures.

02 / 11

His team

A player is part of a unit. Here is how the Philadelphia Eagles do at his job, and who he shares the room with.

Markel is the Eagles' 5th-best offensive lineman by grade (of 5), and the Eagles' offensive line ranks 24th of 32.

Eagles unit

Offensive line: 24th of 32

  • Sacks allowed per dropback7.3% 25th
  • Pressure allowed per dropback19% 14th
  • Rushing yards before contact2.5 16th
  • Runs stopped at or behind the line27% 32nd

Ranked among all 32 teams. See every team.

Philadelphia Eagles offensive linemen

His room, by grade

  1. 1Lane Johnson OL49
  2. 2Drew Kendall OL49
  3. 3Jordan Mailata OL48
  4. 4Tyler Steen OL48
  5. 5Markel Bell OL48

Overall grade, 20 to 80, against all offensive linemen in the league. A teammate with too few plays to grade is listed without one.

03 / 11

How he stacks up

Every graded stat at a glance, against all the offensive linemen in the league.
  • Line run successwhole line's number28%135th of 162small sample
  • Sacks allowed by his linewhole line's number6.9%mostly luck so far

Left is the worst at his job, right is the best, and the line down the middle is average. The bubble is his percentile: 90 means better than nine in ten qualifying offensive linemen. Faded bars are still small samples. Outlined bars are stats where, this early, the gaps between players are mostly luck, so they are not ranked yet.

04 / 11

In the league

Every offensive lineman in the league as a dot: pick any two stats and see where he sits, who is around him, and who is ahead.

Who is around him on the leaderboards

His best numbers, with the offensive linemen just ahead of and behind him. A number is easier to judge beside the names.

Line run success

The offensive linemen just above and below him

  1. 132ndTyler Steen Eagles34%
  2. 134thWill Campbell Patriots33%
  3. 135thMarkel Bell Eagles28%
  4. 136thBlake Brandel Vikings34%
  5. 136thBrian O'Neill Vikings34%

The leader is further up the board.

Sacks allowed by his line

Lower is better. The offensive linemen just above and below him

  1. 92ndGrey Zabel Seahawks6.5%
  2. 92ndJalen Sundell Seahawks6.5%
  3. 96thMarkel Bell Eagles6.9%
  4. 99thAlec Anderson Bills6.7%
  5. 99thConnor McGovern Bills6.7%

The leader is further up the board.

Build and age against the position

Size and age are not good or bad. They show what kind of offensive lineman he is and how he compares physically with the offensive linemen in the league.

Height

6'9"

Markel Bell is taller than 99% of offensive linemen.

Weight

346 lbs

Markel Bell is heavier than 97% of offensive linemen.

Age

22

Markel Bell is younger than 95% of offensive linemen.

05 / 11

How he has progressed

Where he has ranked among offensive linemen after each week, and every game behind it.
WorstMiddleBestrecent12345Week 5: 17th percentile17th

Not enough games yet to draw a line.

The line is his season-to-date rank among players at his position after each week, from 99 (the best in the league) down to 1 (the worst). It rises when he passes other players, not when he has one big game. Early weeks are noisier because fewer plays are behind them. The shaded weeks are the recent stretch.

Line run success game by game
WeekOpponentThat gamerunsSeason rank after
4vs LAR31%26Not yet
5vs JAX24%1717th pct

“Not yet” means too little of the season was behind him to rank him fairly against offensive linemen. A week-by-week rank needs most of the 150 snaps that grade a full season, so early weeks stay blank for players who see few plays, like kickers. It says nothing about how he played.

One game is a small sample: a single stat over 22 runs can swing on a handful of plays. Shaded rows are the recent stretch.

06 / 11

The numbers, in context

Each one against every offensive lineman with at least 150 snaps. Right on the strip is better.

Line run success

Well below typical

28%

135th of 162 offensive linemen · bottom 18%

This is his whole line's number: every lineman who starts beside him shares it, so it says how the unit is doing more than how he is.

How often the team's designed runs gain enough to keep the offense on schedule, in the games he started. It is the line, the backs and the scheme together, and the five linemen who start together share it.

The box score: Team rushing yards ignore the down and the distance.

Does it show up in winning? Across 524 games league-wide, teams won 68% of the time when their offensive lineman was in the best third on line run success, and 49% when he was in the worst third.

Small sample: could move a lot · 43 runs · true level likely 17% to 39%

Sacks allowed by his line

Mostly luck so far

6.9%lower is better

Too early to rank. On 73 dropbacks, luck still decides who is on top of offensive linemen.

This is his whole line's number: every lineman who starts beside him shares it, so it says how the unit is doing more than how he is.

Sacks as a share of the team's dropbacks in the games he started. It is the line and the quarterback together, and every lineman who starts beside him shares it. Fewer is better.

The box score: No sack is charged to a single lineman in the box score.

Does it show up in winning? Across 576 games league-wide, teams won 49% of the time when their offensive lineman was in the best third on sacks allowed by his line, and 30% when he was in the worst third.

Small sample: could move a lot · 73 dropbacks

07 / 11

How he plays

Tendencies: how his game differs from the offensive linemen around him. These are not better or worse, only different, and often say as much about the offense or defense he plays in as about him.

Share of snaps when he plays

Style

72%

Rotates in and out. His number is lower than most offensive linemen'. The typical offensive lineman is at 99% (nearly all).

The share of the offense's snaps he is on the field for in the games he plays. It says whether he is a full-time starter or a part of a rotation.

Solid sample · 173 snaps

08 / 11

Contract & cap

Markel Bell's deal is 4 years and $7.4M, $1.8M a year. $1.8M of it is guaranteed, 25% of the total.

Per year

$1.8M

average over the deal

Cap hit, 2026

$1.3M

0.4% of the $301.2M cap

Guaranteed

$1.8M

25% of the total, at signing

Runs through

–

4-year deal, final year not tracked

127th-highest paid of the 161 offensive linemen we track

Aaron Brewer (MIA): $17.5M a yearAbraham Lucas (SEA): $15.3M a yearAireontae Ersery (HOU): $2.3M a yearAlaric Jackson (LAR): $19.2M a yearAlec Anderson (BUF): $2.5M a yearAlijah Vera-Tucker (NE): $14.0M a yearAmarius Mims (CIN): $3.8M a yearAndrew Thomas (NYG): $23.5M a yearAnthony Belton (GB): $2.0M a yearAnton Harrison (JAX): $3.3M a yearArmand Membou (NYJ): $8.0M a yearAsim Richards (NO): $1.0M a yearAustin Barber (CLE): $1.7M a yearAustin Jackson (MIA): $7.0M a yearAustin Schlottmann (TEN): $3.5M a yearBen Bartch (DET): $1.2M a yearBen Bredeson (TB): $7.3M a yearBen Brown (NE): $1.9M a yearBen Powers (DEN): $6.0M a yearBernhard Raimann (IND): $25.0M a yearBlake Brandel (MIN): $3.2M a yearBlake Miller (DET): $5.5M a yearBrandon Coleman (WAS): $1.5M a yearBraxton Jones (CHI): $5.0M a yearBrian O'Neill (MIN): $24.0M a yearBrock Hoffman (PIT): $2.5M a yearBryan Hudson (NYG): $922K a yearCesar Ruiz (NO): $11.0M a yearCharles Cross (SEA): $26.1M a yearChris Lindstrom (ATL): $20.5M a yearChris Paul (WAS): $3.0M a yearChristian Darrisaw (MIN): $26.0M a yearChristian Haynes (SEA): $1.5M a yearChristian Mahogany (DET): $1.0M a yearCody Mauch (TB): $1.9M a yearCole Strange (LAC): $6.5M a yearCole Van Lanen (JAX): $17.0M a yearColeman Shelton (LAR): $6.0M a yearColton McKivitz (SF): $15.0M a yearConnor Colby (SF): $1.1M a yearConnor McGovern (BUF): $13.1M a yearCooper Beebe (DAL): $1.5M a yearCreed Humphrey (KC): $18.0M a yearDJ Glaze (LV): $1.5M a yearDalton Risner (CIN): $3.2M a yearDamien Lewis (CAR): $13.2M a yearDarnell Wright (CHI): $29.0M a yearDavid Edwards (NO): $15.2M a yearDion Dawkins (BUF): $20.0M a yearDominick Puni (SF): $1.4M a yearDonovan Jackson (MIN): $4.3M a yearDrew Kendall (PHI): $1.1M a yearDylan Fairchild (CIN): $1.6M a yearDylan Parham (NYJ): $8.0M a yearEd Ingram (HOU): $12.5M a yearElgton Jenkins (CLE): $12.0M a yearElijah Wilkinson (ARI): $3.1M a yearEmmanuel Pregnon (JAX): $1.7M a yearErik McCoy (NO): $12.0M a yearEvan Brown (HOU): $2.5M a yearEzra Cleveland (JAX): $8.0M a yearFrancis Mauigoa (NYG): $7.7M a yearGarett Bolles (DEN): $20.5M a yearGarrett Bradbury (CHI): $4.7M a yearGraham Barton (TB): $3.5M a yearGrey Zabel (SEA): $4.6M a yearHjalte Froholdt (ARI): $10.0M a yearIsaac Seumalo (ARI): $10.5M a yearIsaiah Adams (ARI): $1.5M a yearJC Latham (TEN): $6.5M a yearJackson Powers-Johnson (LV): $2.2M a yearJacob Monk (GB): $1.1M a yearJake Brendel (SF): $4.1M a yearJake Matthews (ATL): $22.5M a yearJake Slaughter (LAC): $2.0M a yearJalen Sundell (SEA): $943K a yearJalen Travis (IND): $1.3M a yearJared Wilson (NE): $1.6M a yearJawaan Taylor (ATL): $5.0M a yearJaylon Moore (KC): $15.0M a yearJermaine Eluemunor (NYG): $13.0M a yearJoe Alt (LAC): $8.3M a yearJoe Huber (MIN): $992K a yearJoe Thuney (CHI): $17.5M a yearJoe Tippmann (NYJ): $15.5M a yearJohn Michael Schmitz (NYG): $1.6M a yearJohn Simpson (BAL): $10.0M a yearJonah Jackson (CHI): $14.8M a yearJonah Savaiinaea (MIA): $2.8M a yearJordan Mailata (PHI): $22.0M a yearJordan Meredith (NYJ): $2.0M a yearJordan Morgan (GB): $3.5M a yearJosh Myers (NYJ): $5.5M a yearJovaughn Gwyn (BAL): $1.2M a yearJuice Scruggs (DET): $1.5M a yearKadyn Proctor (MIA): $6.5M a yearKahlil Benson (KC): $1.0M a yearKayode Awosika (LAC): $2.0M a yearKevin Dotson (LAR): $16.0M a yearKeylan Rutledge (HOU): $4.8M a yearKingsley Suamataia (KC): $1.6M a yearKolton Miller (LV): $22.0M a yearLane Johnson (PHI): $25.0M a yearLucas Patrick (WAS): $2.1M a yearLuke Fortner (CAR): $2.8M a yearLuke Goedeke (TB): $22.5M a yearLuke Wattenberg (DEN): $12.0M a yearMason McCormick (PIT): $1.2M a yearMatt Goncalves (IND): $1.5M a yearMatthew Bergeron (ATL): $23.5M a yearMax Iheanachor (PIT): $5.2M a yearMike McGlinchey (DEN): $17.5M a yearMonroe Freeling (CAR): $5.2M a yearMorgan Moses (NE): $8.0M a yearNick Allegretti (WAS): $3.8M a yearO'Cyrus Torrence (BUF): $19.1M a yearOlaivavega Ioane (BAL): $6.1M a yearOlumuyiwa Fashanu (NYJ): $5.1M a yearPatrick Paul (MIA): $1.7M a yearPenei Sewell (DET): $28.0M a yearPeter Skoronski (TEN): $25.0M a yearQuenton Nelson (IND): $20.0M a yearQuinn Meinerz (DEN): $18.0M a yearRashawn Slater (LAC): $28.5M a yearRasheed Walker (CAR): $4.0M a yearRobert Hainsey (JAX): $7.0M a yearRobert Hunt (CAR): $20.0M a yearRoger Rosengarten (BAL): $1.6M a yearRonnie Stanley (BAL): $20.0M a yearRyan Neuzil (ATL): $4.8M a yearSam Cosmi (WAS): $18.5M a yearSean Rhyan (GB): $11.0M a yearSpencer Brown (BUF): $18.0M a yearSpencer Burford (LV): $3.3M a yearSpencer Fano (CLE): $8.1M a yearSteve Avila (LAR): $2.3M a yearTJ Bass (DAL): $5.8M a yearTaliese Fuaga (NO): $4.3M a yearTanor Bortolini (IND): $1.2M a yearTate Ratledge (DET): $1.9M a yearTed Karras (CIN): $5.0M a yearTerence Steele (DAL): $11.0M a yearTheo Benedet (CHI): $1.0M a yearTravis Burke (LAC): $1.4M a yearTravis Glover (GB): $1.0M a yearTrent Brown (HOU): $5.5M a yearTrent Williams (SF): $25.0M a yearTrevor Penning (LAC): $3.5M a yearTrey Smith (KC): $23.5M a yearTristan Wirfs (TB): $28.1M a yearTroy Fautanu (PIT): $3.8M a yearTyler Booker (DAL): $5.6M a yearTyler Guyton (DAL): $3.3M a yearTyler Linderbaum (LV): $27.0M a yearTyler Steen (PHI): $1.4M a yearTytus Howard (CLE): $22.5M a yearWill Campbell (NE): $10.9M a yearWill Fries (MIN): $17.5M a yearZach Frazier (PIT): $1.9M a yearZion Johnson (CLE): $16.5M a yearMarkel Bell: $1.8M a yearBell $1.8M$0$29.0M
Each dot is one of the offensive linemen on the teams we track, placed by what he is paid a year.

Pay against play

Early read

Among the 161 offensive linemen we have a grade and a contract for, Markel Bell is 143rd on the field and 127th in pay. His grade is still an early read, so this says nothing yet about whether his pay is fair.

On the field (overall grade)143 of 161
In pay127 of 161

Ranks are among the 161 offensive linemen on the teams we track who have both a grade and a contract. A rank near the right of a bar is better play or higher pay.

Contract figures as of 2026-10-12, read from public cap sites (StickToTheModel team cap pages and OverTheCap contracts list and player pages) into a file we keep by hand, for all 32 teams. A deal signed, cut or reworked since may differ, and cap hits are rounded to $0.1M.

09 / 11

Playing time

He has played in 3 of his team's 5 games with snap counts, on the field for about 67% of the team's offensive plays when he plays.

Back in the lineup. He missed 2 games earlier, then played all of the last 2 games, on the field for nearly every play when he plays.

Each column is a game: the share of his team's offensive snaps he played. 80% means about 8 of every 10 plays. “Out” means he did not play; a question mark means snap counts are not posted yet. Shaded games are the recent stretch.

10 / 11

Game by game

Every game this season: how it ended for his team, how much he played, his box score, and the advanced numbers from that one game. One game is a small sample, so read the right-hand columns as a snapshot, not his level. A dash means that number is not in yet (charting posts a day or two after a game), not a zero.
Markel Bell game by game
GameResultSnapsSnapsGSPenHoldFSLine runsLine sack rate
Wk 3 vs CHIL 7–272%10000––
Wk 4 vs LARL 20–24100%61110031%12.9%
Wk 5 vs JAXL 17–19100%62110124%2.4%

11 / 11

The box score

The traditional totals, with where each ranks among offensive linemen. A total rewards volume, which is why the advanced numbers above matter.
Markel Bell box score totals
StatTotalRank
Offensive snaps124159th of 162
Games started2150th of 162
Penalties243rd of 162 (most)
Holding penalties088th of 162 (most)
False starts131st of 162 (most)

Ranks are among players at the same job who have enough plays to be graded. Grades and rankings come from play-by-play, charting and snap-count data, so they cannot see blocking, route running or assignments. See how the grades work.

← All players

Data: nflverse play-by-play, CC BY 4.0. Also FTN charting, Pro Football Reference advanced stats, snap counts and injury reports, all through nflverse. Calculations and charts by Raiders Rundown.