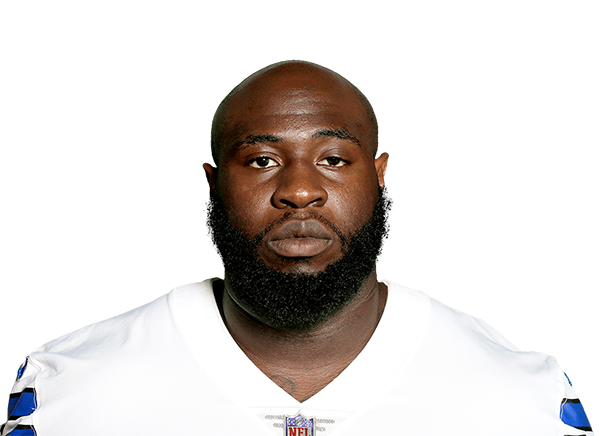

CHI Chicago Bears · DL· #90

Neville Gallimore

Age
29
Height
6'2"
Weight
307 lbs
College
Oklahoma
Drafted
2020, No. 82 overall (DAL)
Experience
7th NFL season

Bears 3-2Offense 11thDefense 20th

50

Overall

44th of 108 interior linemen

Early read

Most of his numbers are still mostly luck; 50 is average

Grades updated Rechecked every few hours on game days

01 / 11

The read

Neville has played 5 games for 6 tackles, 5 solo tackles and 1 assisted tackles, but every advanced number is still mostly luck at this point, so his grade of 50 is a placeholder rather than a verdict.

  • Game to game on pressures per 100 snaps: best 3.4 in Week 1 against CAR, worst 0.0 in Week 5. He beat the typical interior lineman's pressures per 100 snaps in 1 of 5 games.
  • Season rank holding near the 54th percentile since Wk 2.
  • When he plays he is on the field for about 3 of every 10 plays.
  • Too early to call: pressures per 100 snaps and tackles for loss per 100 snaps. After 5 games the gaps between interior linemen on those stats are still mostly chance, so we show them without ranking.

Written from his numbers, not from film. 5 games are behind the season figures.

02 / 11

His team

A player is part of a unit. Here is how the Chicago Bears do at his job, and who he shares the room with.

Neville is the Bears' 2nd-best interior lineman by grade (of 3), and the Bears' pass rush ranks 4th of 32.

Bears unit

Pass rush: 4th of 32

  • Sacks per dropback8.1% 7th
  • Pressure per dropback27% 4th
  • Quarterback hits per dropback16.8% 11th

Ranked among all 32 teams. See every team.

Chicago Bears interior linemen

His room, by grade

  1. 1Grady Jarrett DL51
  2. 2Neville Gallimore DL50
  3. 3Kentavius Street DL50

Overall grade, 20 to 80, against all interior linemen in the league. A teammate with too few plays to grade is listed without one.

03 / 11

How he stacks up

Every graded stat at a glance, against all the interior linemen in the league.
  • Tackles for loss per 100 snaps1.1mostly luck so far
  • Sacks per 100 snaps0.0mostly luck so far
  • Pressures per 100 snaps1.1mostly luck so far

Left is the worst at his job, right is the best, and the line down the middle is average. The bubble is his percentile: 90 means better than nine in ten qualifying interior linemen. Faded bars are still small samples. Outlined bars are stats where, this early, the gaps between players are mostly luck, so they are not ranked yet.

04 / 11

In the league

Every interior lineman in the league as a dot: pick any two stats and see where he sits, who is around him, and who is ahead.

Who is around him on the leaderboards

His best numbers, with the interior linemen just ahead of and behind him. A number is easier to judge beside the names.

Pressures per 100 snaps

The interior linemen just above and below him

  1. 63rdKobie Turner Rams1.2
  2. 64thJowon Briggs Jets1.2
  3. 65thNeville Gallimore Bears1.1
  4. 66thPoona Ford Rams1.0
  5. 67thLee Hunter Panthers0.9

The leader is further up the board.

Tackles for loss per 100 snaps

The interior linemen just above and below him

  1. 34thSebastian Valdez 49ers1.1
  2. 35thNazir Stackhouse Titans1.1
  3. 35thNeville Gallimore Bears1.1
  4. 37thTyler Davis Rams1.0
  5. 38thMoro Ojomo Eagles0.9

The leader is further up the board.

Build and age against the position

Size and age are not good or bad. They show what kind of interior lineman he is and how he compares physically with the interior linemen in the league.

Height

6'2"

Neville Gallimore is shorter than 82% of interior linemen.

Weight

307 lbs

Neville Gallimore is lighter than 53% of interior linemen.

Age

29

Neville Gallimore is older than 65% of interior linemen.

05 / 11

How he has progressed

Where he has ranked among interior linemen after each week, and every game behind it.
WorstMiddleBestrecent12345Week 2: 58th percentileWeek 3: 48th percentileWeek 4: 45th percentileWeek 5: 40th percentile40th

Season rank slipped: 58th to 40th percentile since Wk 2.

The line is his season-to-date rank among players at his position after each week, from 99 (the best in the league) down to 1 (the worst). It rises when he passes other players, not when he has one big game. Early weeks are noisier because fewer plays are behind them. The shaded weeks are the recent stretch.

Pressures per 100 snaps game by game
WeekOpponentThat gamesnapsSeason rank after
1vs CAR3.429Not yet
2vs MIN0.01958th pct
3vs PHI0.01248th pct
4vs NYJ0.01145th pct
5vs GB0.02440th pct

“Not yet” means too little of the season was behind him to rank him fairly against interior linemen. A week-by-week rank needs most of the 80 snaps that grade a full season, so early weeks stay blank for players who see few plays, like kickers. It says nothing about how he played.

One game is a small sample: a single stat over 19 snaps can swing on a handful of plays. Shaded rows are the recent stretch.

06 / 11

The numbers, in context

Each one against every interior lineman with at least 80 snaps. Right on the strip is better.

Pressures per 100 snaps

Mostly luck so far

1.1

Too early to rank. On 95 snaps, luck still decides who is on top of interior linemen.

Sacks, hits and hurries as Pro Football Reference charts them, for every 100 snaps he plays. A pass rusher is doing his job on plays that never become a sack.

The box score: A sack total misses most of what a rusher does and depends on how many snaps he plays.

Does it show up in winning? Across 158 games league-wide, a good or bad game on pressures per 100 snaps from a interior lineman has not lined up much with his team winning (48% wins in the best third, 37% in the worst).

Last 2 games: 0.0 (23) vs 1.4 before.

Small sample: could move a lot · 95 snaps

Sacks per 100 snaps

Mostly luck so far

0.0

Too early to rank. On 95 snaps, luck still decides who is on top of interior linemen.

Sacks for every 100 snaps he plays. Rare, so it swings fast; pressures are the steadier read.

The box score: A sack total ignores how many snaps he played.

Does it show up in winning? Across 158 games league-wide, a good or bad game on sacks per 100 snaps from a interior lineman has not lined up much with his team winning (39% wins in the best third, 36% in the worst).

Last 2 games: 0.0 (23) vs 0.0 before.No change worth reading.

Small sample: could move a lot · 95 snaps

Tackles for loss per 100 snaps

Mostly luck so far

1.1

Too early to rank. On 95 snaps, luck still decides who is on top of interior linemen.

Plays he ends behind the line of scrimmage, for every 100 snaps.

The box score: Tackles for loss are counted, but never against the snaps he played.

Does it show up in winning? Across 158 games league-wide, teams won 47% of the time when their interior lineman was in the best third on tackles for loss per 100 snaps, and 34% when he was in the worst third.

Last 2 games: 0.0 (23) vs 1.4 before.

Small sample: could move a lot · 95 snaps

07 / 11

Contract & cap

Neville Gallimore's deal is 2 years and $10.0M, $5.0M a year. $5.0M of it is guaranteed, 50% of the total.

Per year

$5.0M

average over the deal

Cap hit, 2026

$4.0M

1.3% of the $301.2M cap

Guaranteed

$5.0M

50% of the total, at signing

Runs through

–

2-year deal, final year not tracked

48th-highest paid of the 107 interior linemen we track

Aaron Hall (CAR): $1.0M a yearAdam Butler (LV): $5.5M a yearAdetomiwa Adebawore (IND): $1.2M a yearAdin Huntington (CLE): $995K a yearAlim McNeill (DET): $24.2M a yearArik Armstead (JAX): $14.5M a yearBobby Brown III (CAR): $7.0M a yearBraden Fiske (LAR): $2.4M a yearBrandon Dorlus (ATL): $1.2M a yearByron Murphy II (SEA): $4.0M a yearCalais Campbell (BAL): $5.5M a yearCameron Heyward (PIT): $18.0M a yearChris Jones (KC): $31.8M a yearChris McClellan (GB): $1.8M a yearChristian Barmore (NE): $21.0M a yearColby Wooden (NO): $1.2M a yearCory Durden (NE): $1.1M a yearD.J. Jones (DEN): $13.0M a yearDJ Reader (NYG): $6.2M a yearDaVon Hamilton (JAX): $11.5M a yearDalvin Tomlinson (LAC): $6.5M a yearDarius Alexander (NYG): $1.7M a yearDarius Robinson (ARI): $3.5M a yearDaron Payne (WAS): $22.5M a yearDarrell Jackson Jr. (NYJ): $1.4M a yearDavon Godchaux (NO): $5.5M a yearDeForest Buckner (IND): $23.0M a yearDeWayne Carter (BUF): $1.4M a yearDeone Walker (BUF): $1.3M a yearDerrick Harmon (PIT): $4.5M a yearDevonte Wyatt (GB): $18.3M a yearDexter Lawrence (CIN): $28.0M a yearFoley Fatukasi (LV): $1.3M a yearGervon Dexter Sr. (ATL): $1.7M a yearGracen Halton (SF): $1.4M a yearGrady Jarrett (CHI): $14.5M a yearGreg Gaines (BUF): $1.5M a yearGrover Stewart (IND): $13.0M a yearHarrison Phillips (NYJ): $7.5M a yearJalen Carter (PHI): $38.0M a yearJamaree Caldwell (LAC): $1.6M a yearJarran Reed (SEA): $7.3M a yearJavon Hargrave (GB): $11.5M a yearJavon Kinlaw (WAS): $15.0M a yearJeffery Simmons (TEN): $35.3M a yearJerry Tillery (IND): $1.5M a yearJonah Laulu (LV): $1.0M a yearJonathan Allen (CIN): $12.5M a yearJonathan Ford (GB): $1.5M a yearJordan Davis (PHI): $26.0M a yearJordan Elliott (TEN): $4.0M a yearJordan Phillips (MIA): $1.2M a yearJoshua Farmer (NE): $1.2M a yearJowon Briggs (NYJ): $1.1M a yearKarl Brooks (GB): $1.0M a yearKeeanu Benton (PIT): $18.0M a yearKenny Clark (DAL): $21.3M a yearKentavius Street (CHI): $1.5M a yearKhristian Boyd (NO): $1.1M a yearKhyiris Tonga (KC): $7.0M a yearKobie Turner (LAR): $1.3M a yearKris Jenkins (CIN): $2.0M a yearLT Overton (DAL): $1.1M a yearLaCale London (ATL): $2.8M a yearLee Hunter (CAR): $2.5M a yearLeonard Williams (SEA): $30.0M a yearLevi Drake Rodriguez (MIN): $1.0M a yearMaason Smith (ATL): $2.0M a yearMalcolm Roach (DEN): $8.8M a yearMaliek Collins (CLE): $10.0M a yearMason Graham (CLE): $10.2M a yearMatt Dickerson (JAX): $1.4M a yearMike Hall Jr. (CLE): $1.8M a yearMilton Williams (NE): $26.0M a yearMoro Ojomo (PHI): $979K a yearNathan Shepherd (NO): $4.3M a yearNazir Stackhouse (TEN): $993K a yearNnamdi Madubuike (BAL): $24.5M a yearOsa Odighizuwa (SF): $20.0M a yearPeter Woods (KC): $4.5M a yearPoona Ford (LAR): $9.2M a yearQuinnen Williams (DAL): $35.3M a yearRoy Lopez (ARI): $5.2M a yearRuke Orhorhoro (JAX): $2.5M a yearShelby Harris (NYG): $3.0M a yearSheldon Rankins (HOU): $8.5M a yearShy Tuttle (WAS): $1.3M a yearSkyler Gill-Howard (DET): $1.2M a yearSolomon Thomas (TEN): $3.0M a yearT'Vondre Sweat (NYJ): $2.4M a yearTeRah Edwards (CAR): $885K a yearTeair Tart (LAC): $10.0M a yearTedarrell Slaton (CIN): $7.0M a yearThomas Booker (LV): $3.7M a yearTim Settle (WAS): $8.0M a yearTommy Togiai (HOU): $2.7M a yearTonka Hemingway (LV): $1.2M a yearTravis Jones (BAL): $13.5M a yearTyleik Williams (DET): $4.1M a yearTyler Davis (LAR): $1.1M a yearVernon Broughton (NO): $1.7M a yearVita Vea (TB): $30.0M a yearWalter Nolen (ARI): $4.8M a yearYahya Black (PIT): $1.1M a yearZach Sieler (MIA): $21.3M a yearZeek Biggers (MIA): $1.1M a yearNeville Gallimore: $5.0M a yearGallimore $5.0M$0$38.0M
Each dot is one of the interior linemen on the teams we track, placed by what he is paid a year.

Pay against play

Early read

Among the 107 interior linemen we have a grade and a contract for, Neville Gallimore is 43rd on the field and 48th in pay. His grade is still an early read, so this says nothing yet about whether his pay is fair.

On the field (overall grade)43 of 107
In pay48 of 107

Ranks are among the 107 interior linemen on the teams we track who have both a grade and a contract. A rank near the right of a bar is better play or higher pay.

Contract figures as of 2026-10-12, read from public cap sites (StickToTheModel team cap pages and OverTheCap contracts list and player pages) into a file we keep by hand, for all 32 teams. A deal signed, cut or reworked since may differ, and cap hits are rounded to $0.1M.

08 / 11

Playing time

He has played in 4 of his team's 4 games with snap counts, on the field for about 35% of the team's defensive plays when he plays.

Each column is a game: the share of his team's defensive snaps he played. 80% means about 8 of every 10 plays. “Out” means he did not play; a question mark means snap counts are not posted yet. Shaded games are the recent stretch.

09 / 11

Game by game

Every game this season: how it ended for his team, how much he played, his box score, and the advanced numbers from that one game. One game is a small sample, so read the right-hand columns as a snapshot, not his level. A dash means that number is not in yet (charting posts a day or two after a game), not a zero.

Pressures per 100 snapsHigher is better

▲ Best game
3.4per 100 snapsWeek 1 CAR, W 59–371 pressure in 29 snaps
▼ Worst game
0.0per 100 snapsWeek 5 GB, L 7–310 pressures in 24 snaps

Tackles for loss per 100 snapsHigher is better

▲ Best game
4.2per 100 snapsWeek 5 GB, L 7–311 tackle for loss in 24 snaps
▼ Worst game
0.0per 100 snapsWeek 4 NYJ, W 23–120 tackles for loss in 11 snaps
Neville Gallimore game by game
GameResultSnapsTklSoloAstTFLSacksPressPBUIntMissedPressures/100TFL/100
Wk 1 vs CARW 59–3743%1010010003.40.0
Wk 2 vs MINL 3–937%2200000000.00.0
Wk 3 vs PHIW 27–724%1100000000.00.0
Wk 4 vs NYJW 23–1234%1100000000.00.0
Wk 5 vs GBL 7–31–1101––0––0.04.2

10 / 11

The box score

The traditional totals, with where each ranks among interior linemen. A total rewards volume, which is why the advanced numbers above matter.
Neville Gallimore box score totals
StatTotalRank
Tackles689th of 108
Solo tackles533rd of 108
Assisted tackles1106th of 108
Tackles for loss133rd of 108
Sacks044th of 108
Pressures164th of 108
Passes defended033rd of 108
Interceptions01st of 108
Missed tackles045th of 108 (most)

11 / 11

Players with a similar profile

The interior linemen whose grades are closest to his across the same stats. Similar means similar numbers, not the same style of play.

Ranks are among players at the same job who have enough plays to be graded. Grades and rankings come from play-by-play, charting and snap-count data, so they cannot see blocking, route running or assignments. See how the grades work.

← All players

Data: nflverse play-by-play, CC BY 4.0. Also FTN charting, Pro Football Reference advanced stats, snap counts and injury reports, all through nflverse. Calculations and charts by Raiders Rundown.