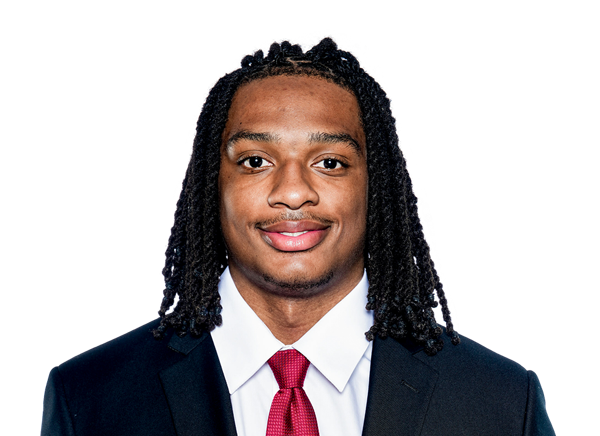

SF San Francisco 49ers · LB· #53

Jaden Dugger

Age
22
Height
6'5"
Weight
240 lbs
College
Louisiana; Georgetown
Drafted
2026, No. 154 overall (SF)
Experience
Rookie

38

Overall grade

126th of 132 edge rushers

Among the weakest

well below average; 50 is average

Grades updated Rechecked every few hours on game days

The read

Jaden grades well below average among edge rushers so far, with no number far from the middle.

Written from his numbers, not from film. 5 games are behind the season figures.

How he stacks up

Every graded stat at a glance, against all the edge rushers in the league.

  • Sacks per 100 snaps0.084th of 132small sample
  • Tackles for loss per 100 snaps0.095th of 132small sample
  • Pressures per 100 snaps0.0121st of 132

Left is the worst at his job, right is the best, and the line down the middle is average. The bubble is his percentile: 90 means better than nine in ten qualifying edge rushers. Faded bars are still small samples.

How he has progressed

Where he has ranked among edge rushers after each week, and every game behind it.

WorstMiddleBestrecent12345Week 2: 9th percentileWeek 3: 8th percentileWeek 4: 5th percentile5th

Season rank holding near the 5th percentile since Wk 2.

The line is his season-to-date rank among players at his position after each week, from 100 (the best) to 0 (the worst). It rises when he passes other players, not when he has one big game. Early weeks are noisier because fewer plays are behind them. The shaded weeks are the recent stretch.

Pressures per 100 snaps game by game
WeekOpponentThat gamesnapsSeason rank after
1vs LAR0.034–
2vs MIA0.0189th pct
3vs ARI0.0338th pct
4vs DEN0.0155th pct

One game is a small sample: a single stat over 25 snaps can swing on a handful of plays. Shaded rows are the recent stretch.

The numbers, in context

Each one against every edge rusher with at least 80 snaps. Right on the strip is better.

Pressures per 100 snaps

Among the weakest

0.0

121st of 132 edge rushers · bottom 10%

Sacks, hits and hurries as Pro Football Reference charts them, for every 100 snaps he plays. A pass rusher is doing his job on plays that never become a sack.

The box score: A sack total misses most of what a rusher does and depends on how many snaps he plays.

Does it show up in winning? Across 233 games league-wide, teams won 60% of the time when their edge rusher was in the best third on pressures per 100 snaps, and 47% when he was in the worst third.

Last 2 games: 0.0 (48) vs 0.0 beforeevenWithin the noise

Sample still growing · 100 snaps · true level likely -1.6 to 1.6

Sacks per 100 snaps

Below typical

0.0

84th of 132 edge rushers · bottom 38%

Sacks for every 100 snaps he plays. Rare, so it swings fast; pressures are the steadier read.

The box score: A sack total ignores how many snaps he played.

Does it show up in winning? Across 233 games league-wide, a good or bad game on sacks per 100 snaps from a edge rusher has not lined up much with his team winning (47% wins in the best third, 60% in the worst).

Last 2 games: 0.0 (48) vs 0.0 beforeevenWithin the noise

Small sample: could move a lot · 100 snaps · true level likely -1.6 to 1.6

Tackles for loss per 100 snaps

Below typical

0.0

95th of 132 edge rushers · bottom 29%

Plays he ends behind the line of scrimmage, for every 100 snaps.

The box score: Tackles for loss are counted, but never against the snaps he played.

Does it show up in winning? Across 233 games league-wide, a good or bad game on tackles for loss per 100 snaps from a edge rusher has not lined up much with his team winning (53% wins in the best third, 55% in the worst).

Last 2 games: 0.0 (48) vs 0.0 beforeevenWithin the noise

Small sample: could move a lot · 100 snaps · true level likely -1.6 to 1.6

Playing time

He has played in 4 of his team's 4 games with snap counts, on the field for about 37% of the team's defensive plays when he plays.

Each column is a game: the share of his team's defensive snaps he played. 80% means about 8 of every 10 plays. “Out” means he did not play; a question mark means snap counts are not posted yet. Shaded games are the recent stretch.

Game by game

Every game this season: how it ended for his team, how much he played, his box score, and the advanced numbers from that one game. One game is a small sample, so read the right-hand columns as a snapshot, not his level.

Jaden Dugger game by game
GameResultSnapsTklSoloAstTFLSacksPressPBUIntMissedPressures/100TFL/100
Wk 1 vs LARW 27–756%4130000000.00.0
Wk 2 vs MIAW 35–1331%2110000000.00.0
Wk 3 vs ARIW 36–3038%1100000010.00.0
Wk 4 vs DENW 24–1423%0000000000.00.0
Wk 5 vs SEAW 32–29–972100000––

The box score

The traditional totals, with where each ranks among edge rushers. A total rewards volume, which is why the advanced numbers above matter.

Jaden Dugger box score totals
StatTotalRank
Tackles1617th of 132
Solo tackles1014th of 132
Assisted tackles640th of 132
Tackles for loss173rd of 132
Sacks084th of 132
Pressures0121st of 132
Passes defended050th of 132
Interceptions010th of 132
Missed tackles128th of 132

Players with a similar profile

The edge rushers whose grades are closest to his across the same stats. Similar means similar numbers, not the same style of play.

Ranks are among players at the same job who have enough plays to be graded. Grades and rankings come from play-by-play, charting and snap-count data, so they cannot see blocking, route running or assignments. See how the grades work.

← All players

Data: nflverse play-by-play, CC BY 4.0. Also FTN charting, Pro Football Reference advanced stats, snap counts and injury reports, all through nflverse. Calculations and charts by Raiders Rundown.