
Players › Compare
Compare two players
Put two players who do the same job side by side. For each stat you see where both rank in the league, and whether the gap between them is bigger than the noise a few plays create.
Grades updated Rechecked every few hours on game days

 Chicago Bears · P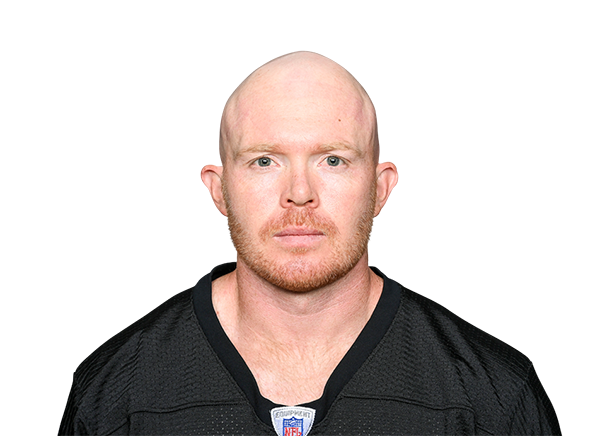
 Pittsburgh Steelers · P
On the stats that count, Tory Taylor and Cameron Johnston are too close to separate with the plays we have. 4 are too close to call.
The year so far: EPA per punt
Where each has ranked among punters after every week. Solid line is Tory Taylor, dashed is Cameron Johnston.
Stat by stat
EPA per punt
Too close to callA +0.492nd of 33
−0.33worse to better+0.25B +0.254th of 33
Net yards per punt
Too close to callA 44.0 yds8th of 33
39.5 ydsworse to better45.0 ydsB 42.0 yds18th of 33
Punts inside the 20
Too close to callA 36%20th of 33
29%worse to better63%B 38%18th of 33
Touchbacks (lower is better)
Too close to callA 9%22nd of 33
13%worse to better0%B 13%28th of 33
Style
- Gross punt averageTory Taylor: 50.8 yds · Cameron Johnston: 49.3 yds
- Fair catchesTory Taylor: 18% · Cameron Johnston: 19%
“Clearly ahead” means the gap is bigger than what the plays behind each number could produce by chance. “Slightly” means it points one way but could still be noise.
Data: nflverse play-by-play, CC BY 4.0. Also FTN charting, Pro Football Reference advanced stats, snap counts and injury reports, all through nflverse. Calculations and charts by Raiders Rundown.
More from the Lab
All 9 tools →- NFL Playoff MachineNewThrough week 5Pick every game left and watch the seeds, bracket and playoff odds move.
- Sunday Rooting GuideNewThrough week 5Which games to root for, ranked by how much each moves your team's playoff odds.
- This week's matchupsWeek 5Every game on the slate, position group by position group.
- Top playsThe snaps that moved the Raiders' chance to win the most.
- Scouting reportsWeek 5Where the Raiders have the edge on every opponent.
- How all 32 teams stack upQuarterback, line, receivers and coverage, ranked across the league.
- Will it last?The Raiders' hottest and coldest stats, against teams since 1999.
- Season twinsThe past teams that looked the most like these Raiders.